The DC/OS Percona XtraDB Cluster service provides a robust API (accessible by HTTP or DC/OS CLI) for managing, repairing, and monitoring the service. Here, only the CLI version is presented for conciseness, but see the API Reference for HTTP instructions.
Plan Operations
An instance of the DC/OS Percona XtraDB Cluster service is ultimately a set of plans (how to run the service) and a set of pods (what to run). The service is driven primarily by two plans, deploy and recovery.
The deploy plan is used during initial installation, as well as during configuration and service updates. The recovery plan is an always-running plan that ensures that the pods and tasks that should be running, stay running. Other plans (“sidecars”) are used for secondary operations.
Every plan is made up of a set of phases, each of which consists of one or more steps.
Listing plans
A list of plans can be retrieved using the CLI command:
dcos percona-pxc-mysql --name=percona-pxc-mysql plan list
Inspecting a plan
View the current status of a plan using the CLI command:
dcos percona-pxc-mysql --name=percona-pxc-mysql plan status <plan-name>
For example, the status of the completed deploy plan of the service will be:
dcos percona-pxc-mysql --name=percona-pxc-mysql plan status deploy
dcos percona-pxc-mysql --name=percona-pxc-mysql plan status deploy
  ├─ proxysql (serial strategy) (COMPLETE)
  │  └─ proxysql-0:[psql] (COMPLETE)
  ├─ node (serial strategy) (COMPLETE)
  │  ─ pxc-0:[init] (COMPLETE)
  │  ├─ pxc-0:[node] (COMPLETE)
  │  ├─ pxc-1:[node] (COMPLETE)
  │  └─ pxc-2:[node] (COMPLETE)
  ├─ mysqldexporter (serial strategy) (COMPLETE)
  │  └─ mysqldexporter-0:[exporterstart] (COMPLETE)
    └─ psqlconf (serial strategy) (COMPLETE)
    └─ psqlconf-0:[mysqlcli] (COMPLETE)
Operating on a plan
Start
Start a plan with the CLI command:
dcos percona-pxc-mysql --name=percona-pxc-mysql plan start <plan-name>
Pause
Pauses the plan, or a specific phase in that plan with the provided phase name (or UUID).
dcos percona-pxc-mysql --name=percona-pxc-mysql plan pause <plan (required)> <phase (optional)>
Stop
Stops the running plan with the provided name.
dcos percona-pxc-mysql --name=percona-pxc-mysql plan stop <plan>
Plan Stop differs from Plan Pause in the following ways:
- Pause can be issued for a specific phase or for all phases within a plan. Stop can only be issued for a plan.
- Pause updates the underlying Phase/Step state. Stop both ceases execution and of the plan and resets the plan to its initial pending state.
Resume
Resumes the plan, or a specific phase in that plan, with the provided phase name (or UUID).
dcos percona-pxc-mysql --name=percona-pxc-mysql plan resume <plan (required)> <phase (optional)>
Force-Restart
Restarts the specified step, phase if no step is specified, or plan if no phase is specified.
dcos percona-pxc-mysql --name=percona-pxc-mysql force-restart <plan (required)> <phase (optional)> <step (optional)>
Force-Complete
Force completes a specific step in the provided phase of the plan. From the CLI it is only possible to force complete a step. The HTTP API supports force completing on phases and plans in their entirety.
dcos percona-pxc-mysql --name=percona-pxc-mysql force-complete <plan (required)> <phase (required)> <step (required)>
Pod Operations
A deployed instance of the DC/OS Percona XtraDB Cluster service is made up of a set of running pods. Using the pod API, it is possible to manage the lifecycle of these pods as well as investigate failures of the pods and their tasks.
List
To list all the pods of the service run the CLI command:
dcos percona-pxc-mysql --name=percona-pxc-mysql pod list
Status
To view the status of all pods or optionally just one pod run the CLI command:
dcos percona-pxc-mysql --name=percona-pxc-mysql pod status <pod-name (optional)>
This will show any status overrides for pods and their tasks.
Restart
To restart a pod in place, use the CLI command:
dcos percona-pxc-mysql --name=percona-pxc-mysql pod restart <pod-name>
This will kill the tasks of the pod, and relaunch them in-place. The progress of the restart can be monitored by watching the recovery plan of the service.
Replace
Replace should be used only when the current instance of the pod should be completely destroyed. All persistent data (read: volumes) of the pod will be destroyed. Replace should be used when a DC/OS agent is being removed, is permanently down, or pod placement constraints need to be updated.
Issue a replace by running the CLI command:
dcos percona-pxc-mysql --name=percona-pxc-mysql pod replace <pod-name>
Pause
Pausing a pod relaunches it in an idle command state. This allows you to debug the contents of the pod, possibly making changes to fix problems, while still having access to all the context of the pod (such as volumes)
Using pause and dcos task exec is a very powerful debugging tool. To pause a pod use the CLI command:
dcos percona-pxc-mysql --name=percona-pxc-mysql debug pod pause <pod-name>
To pause a specific task of a pod append the -t <task-name> flag,
dcos percona-pxc-mysql --name=percona-pxc-mysql debug pod pause <pod-name> -t <task-name>
Use the pod status command to check what tasks and pods are in an overridden state.
Resume
To resume a paused pod or task use the CLI command:
dcos percona-pxc-mysql --name=percona-pxc-mysql debug pod resume <pod-name> [-t <task-name>]
Check the pod status command to verify that the pod (or task) has properly resumed.
Service Metrics
The DC/OS Percona XtraDB Cluster service pushes metrics into the DC/OS metrics system. Details on consuming them can be found at the documentation on the DC/OS metrics system.
Logging
DC/OS has three ways to access service scheduler and service task logs.
- Via the DC/OS GUI
- Via the Mesos GUI
- Via the DC/OS CLI
DC/OS GUI
A service’s logs are accessed by selecting the service in the Services tab. Both the service scheduler and service tasks are displayed side by side in this view. To view the tasks sandbox (files) as well as its stdout and stderr, click on a task.
Mesos GUI
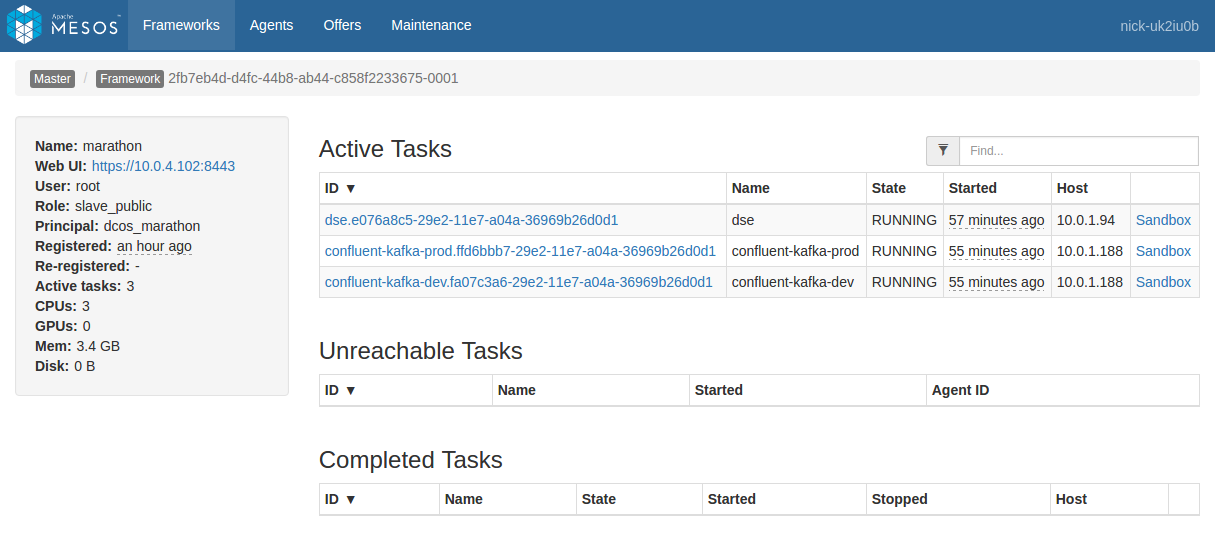
The Mesos GUI provides similar access as that of the DC/OS UI, but the service scheduler is separate from the service tasks. The service tasks can all be found in the Frameworks tab under the framework with the same name as the service. The service scheduler can be found in the Marathon framework, it will be a task with the same name as the service.
Access both the files and logs of a service by clicking on its sandbox link.
Figure 1 - Scheduler sandbox
DC/OS CLI
The dcos task log subcommand allows you to pull logs from multiple tasks at the same time. The dcos task log <task-pattern> command will fetch logs for all tasks matching the prefix pattern. See the help of the subcommand for full details of the command.
Mesos Agent logs
Occasionally, it can also be useful to examine what a given Mesos agent is doing. The Mesos Agent handles deployment of Mesos tasks to a given physical system in the cluster. One Mesos Agent runs on each system. These logs can be useful for determining if there is a problem at the system level that is causing alerts across multiple services on that system.
Mesos agent logs can be accessed via the Mesos GUI or directly on the agent. The GUI method is described here.
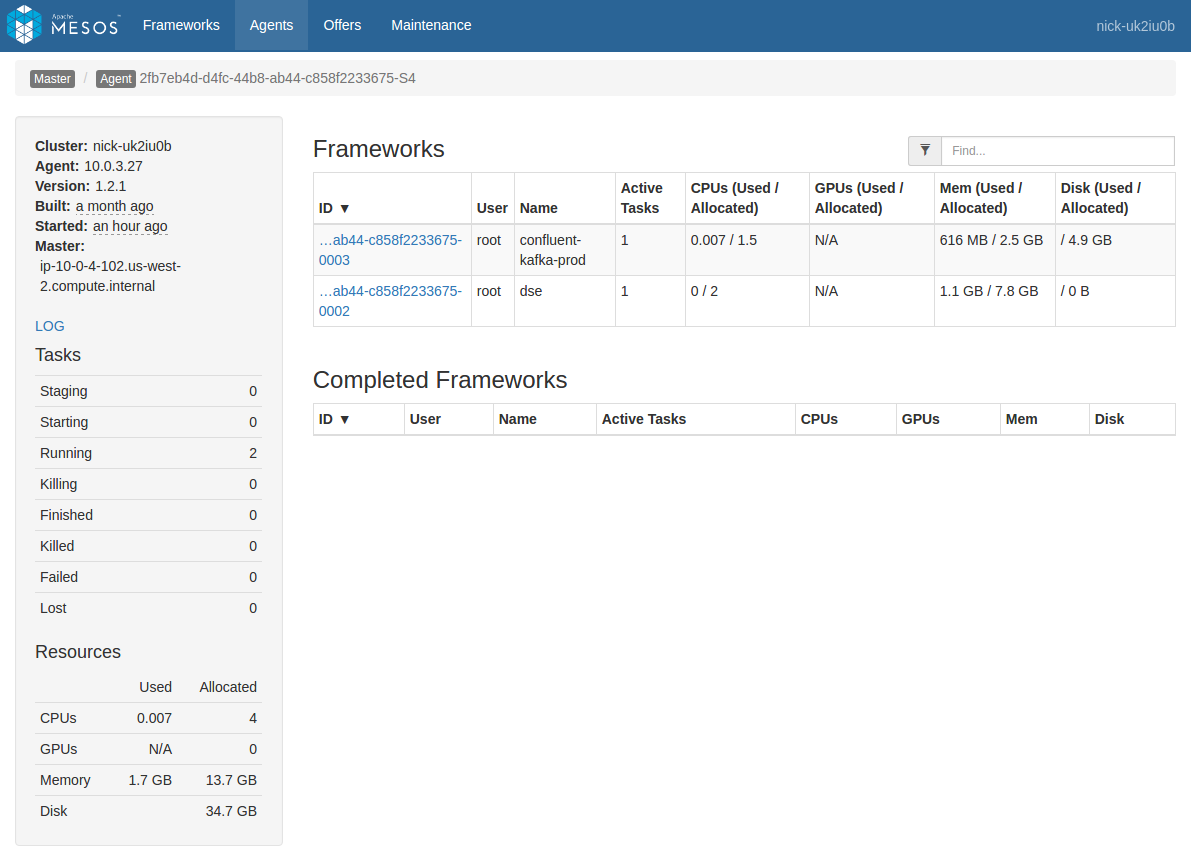
Navigate to the agent you want to view either directly from a task by clicking the “Agent” item in the breadcrumb when viewing a task (this will go directly to the agent hosting the task), or by navigating through the “Agents” menu item at the top of the screen (you will need to select the desired agent from the list).
In the Agent view, you will see a list of frameworks with a presence on that Agent. In the left pane you will see a plain link named “LOG”. Click that link to view the agent logs.
Figure 2 - List of frameworks
External Client Access (ProxySQL and Edge-LB configuration)
Configuring ProxySQL
ProxySQL is auto configured by the service with these defaults:
- Refresh Interval: 2000
- Threads: 2
- Max Connections: 2048
- Default Query Timeout: 10000
- Poll Timeout: 2000
- Default Schema: information_schema
- Stacksize: 1048576
- Connect Timeout Server: 10000
- Monitor History: 60000
- Monitor Connect Interval: 20000
- Monitor Ping Interval: 10000
- Ping Timeout Server: 200
- Commands Stats: True
- Sessions Sort: True
Configuring Edge-LB
-
Install Edge-LB using the following steps:
dcos package repo add --index=0 edgelb-aws \
https://edge-lb-infinity-artifacts.s3.amazonaws.com/autodelete7d/master/edgelb/stub-universe-edgelb.json
dcos package repo add --index=0 edgelb-pool-aws \ https://edge-lb-infinity-artifacts.s3.amazonaws.com/autodelete7d/master/edgelb-pool/stub-universe-edgelb-pool.jsondcos package install edgelb --yesdcos package install edgelb --clidcos edgelb create pxc-edgelb.json -
In the
pxc-edgelb.jsonfile, update theproxysql-client-endpointaccordingly:
{
  "apiVersion": "V2",
  "name": "pxc",
  "count": 1,
  "haproxy": {
    "frontends": [{
      "bindPort": 3306,
      "protocol": "TCP",
      "linkBackend": {
        "defaultBackend": "pxc"
      }
    }],
    "backends": [{
      "name": "pxc",
      "protocol": "TCP",
      "services": [{
        "endpoint": {
          "type": "ADDRESS",
          "address": "<proxysql-client-endpoint>",
          "port": 3306
        }
      }]
    }]
  }
}
-
Run the following command from any host machine running Docker:
docker run --name mysql-cli -e MYSQL_ROOT_PASSWORD=root -d mysql:5.7 -
Get into the container by running a bash into this as follows:
sudo docker exec -ti mysql-cli bash -
Note down the public slave security group IP address for the DC/OS cluster on which DC/OS is running. Use this IP address in the following command:
mysql -u<application_user_name> -p<application_user_passwd> -h<public_slave_securitygrpIP> -P3306This will connect to your Percona XtraDB Cluster cluster.
Now you may start using the cluster by creating a database and tables on it.
Install
Installation guide, best practices and constraints…Read More
Security
Encryption, authentication, and authorization mechanisms…Read More
Disaster Recovery
Back up and restore your data…Read More
Troubleshooting
Troubleshooting Percona XtraDB Cluster…Read More
Uninstalling
Uninstalling DC/OS Percona XtraDB Cluster Service…Read More
 Pxc Documentation
