The file system paths of DC/OS task logs contain information such as the agent ID, framework ID, and executor ID. You can use this information to filter the log output for specific tasks, applications, or agents.
Prerequisite
Configuration
You can configure Splunk either by using the Splunk Web interface or by editing the props.conf file.
Splunk web interface
-
Navigate to Settings -> Fields -> Field Extractions -> New.
-
Fill out the form with the following:
- Destination app:
search - Name:
dcos_task(or any unique, meaningful name for the extraction) - Apply to
sourcenamed/var/lib/mesos/slave/... - Type:
Inline - Extraction/Transform:
/var/lib/mesos/slave/slaves/(?<agent>[^/]+)/frameworks/(?<framework>[^/]+)/executors/(?<executor>[^/]+)/runs/(?<run>[^/]+)/.* in source
- Destination app:
-
Click Save.
-
In the Field Extractions view, find the extraction you just created and set the permissions appropriately. The
agent,framework,executor, andrunfields should now be available to use in search queries and appear in the fields associated with Mesos task log events.
props.conf
-
Add the following entry to
props.conf(see the Splunk documentation for details):[source::/var/lib/mesos/slave/...] EXTRACT = /var/lib/mesos/slave/slaves/(?<agent>[^/]+)/frameworks/(?<framework>[^/]+)/executors/(?<executor>[^/]+)/runs/(?<run>[^/]+)/.* in source -
Run the following search in the Splunk Web interface to ensure the changes take effect:
extract reload=true
The agent, framework, executor, and run fields should now be available to use in search queries and appear in the fields associated with Mesos task log events.
Usage example
-
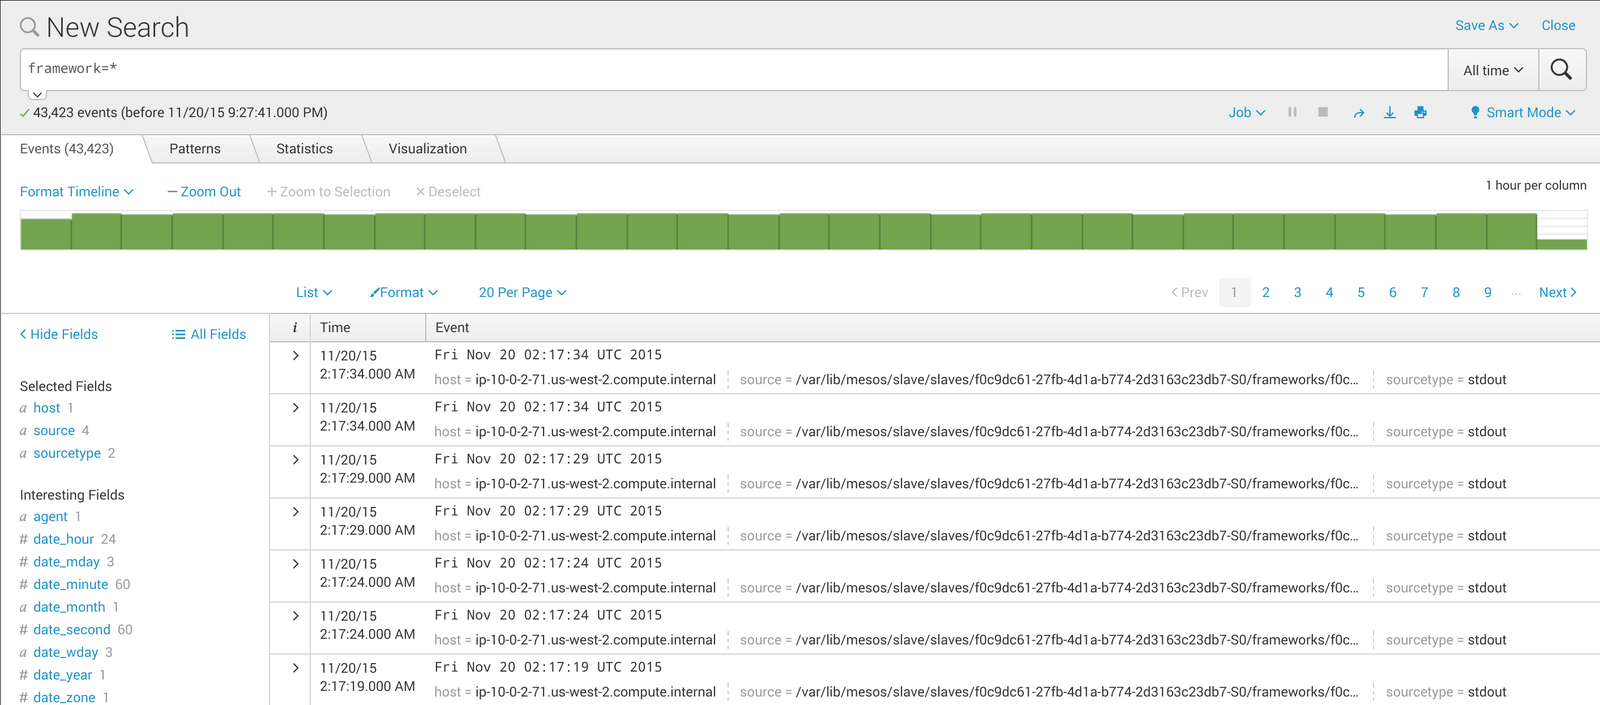
In the Splunk web interface, type
framework=*into the Search field. This will show all of the events where theframeworkfield is defined:
Figure 1. Splunk events screen
-
Click the disclosure triangle next to one of these events to view the details. This will show all of the fields extracted from the task log file path:

Figure 2. Fields in the task log file path
-
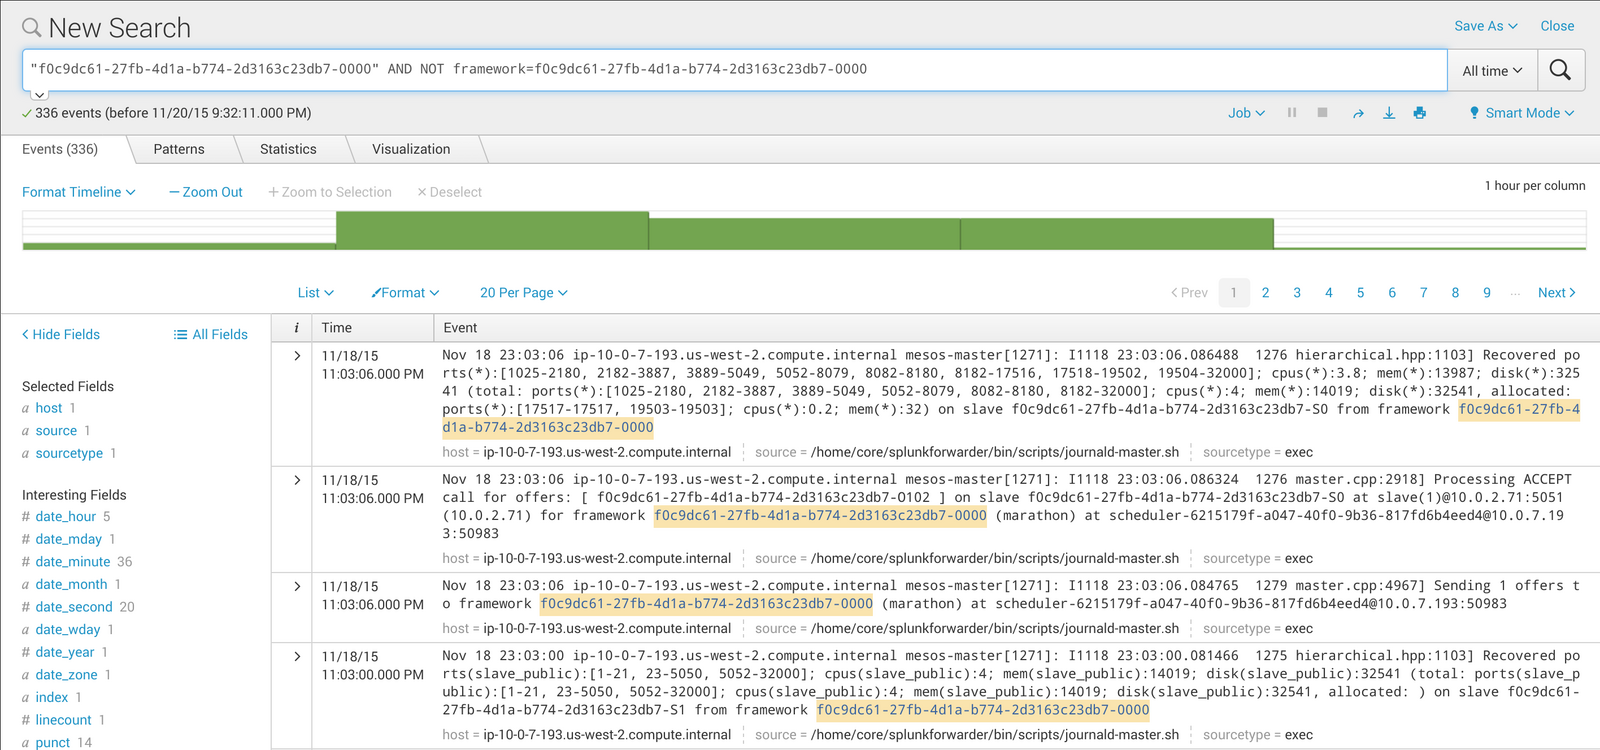
Search for all of the events that reference the framework ID of the event shown in the screenshot above, but that do not contain the chosen
frameworkfield. This will show us only non-task results:
Figure 3. Search results
Template examples
Here are example query templates for aggregating the DC/OS logs with Splunk. Replace the template parameters $executor1, $framework2, and any others with actual values from your cluster.
-
Logs related to a specific executor
$executor1, including logs for tasks run from that executor:"$executor1" -
Non-task logs related to a specific executor
$executor1:"$executor1" AND NOT executor=$executor1 -
Logs (including task logs) for a framework
$framework1, if$executor1and$executor2are that framework’s executors:"$framework1" OR "$executor1" OR "$executor2" -
Non-task logs for a framework
$framework1, if$executor1and$executor2are that framework’s executors:("$framework1" OR "$executor1" OR "$executor2") AND NOT (framework=$framework1 OR executor=$executor1 OR executor=$executor2) -
Logs for a framework
$framework1on a specific agent host$agent_host1:host=$agent_host1 AND ("$framework1" OR "$executor1" OR "$executor2") -
Non-task logs for a framework
$framework1on a specific agent$agent1with host$agent_host1:host=$agent_host1 AND ("$framework1" OR "$executor1" OR "$executor2") AND NOT agent=$agent
 DC/OS Documentation