The Services page provides a full-featured interface to the native DC/OS Marathon instance. It provides a comprehensive view of all of the services that you are running. You can filter services by health, status, or service name.

Figure 1 - Services page
By default, all of your services are displayed, sorted by service name. You can also sort the services by health status, version, region, instances, CPU, memory, disk space or GPU usage.
| Name | Description |
|---|---|
| Name | The DC/OS service name of the service |
| Status | The status of the service. See details in the following table. |
| Version | The version of the service |
| Region | The region of the service |
| Instances | The number of instances of the service |
| CPU | The number of CPUs in use |
| Mem | The amount of memory in use |
| Disk | The amount of disk space in use |
| GPU | The amount of GPU in use |
Service Status
| Status | Description |
|---|---|
| Running | The Service is reported as running and no instances are reported as deploying or recovering. |
| Deploying | When you request a change to the Service, DC/OS is performing the required actions, which have not completed yet. If a Service is having difficulty getting to a Running state, a warning icon is displayed. This indicates that the Service is waiting for the resource offers it requires to run, or that too many tasks have failed in a short amount of time. More information can be obtained from the Debug tab. |
| Recovering | When a change to the Service has been requested by DC/OS, the instance is killed and a new instance is started. Similar to Deploying, DC/OS is performing the required actions, which have not completed yet. |
| Stopped | A Service with target instances of 0 and with a running tasks count of 0. This state was previously referred to as “Suspended” in the UI. |
SDK Service Status
Scheduler tasks based on the DC/OS SDK are leveraging Mesos native checks in order to provide more detailed information about their status than the above Service Status. These status are specific to SDK based schedulers and their lifecycle.
| Status | Description |
|---|---|
| Initializing | Scheduler is initializing. |
| Running | All monitored Plans are complete. |
| Error Creating Service | Scheduler encountered an error creating the service. |
| Deploying (Awaiting Resources) | One or more monitored plans are deploying (awaiting resources). |
| Deploying | One or more monitored plans are deploying. |
| Deploying (Awaiting User Input) | One or more monitored plans are awaiting user input. |
| Degraded (Awaiting Resources) | One or more monitored plans are degraded (awaiting resources). |
| Degraded (Recovering) | One or more monitored plans are degraded (recovering). |
| Backing up | One or more monitored backup plans is in-progress. |
| Restoring | One or more monitored restore plans is in-progress. |
| Service Unavailable | Scheduler encountered an error with one or more monitored plans. |
Tabs
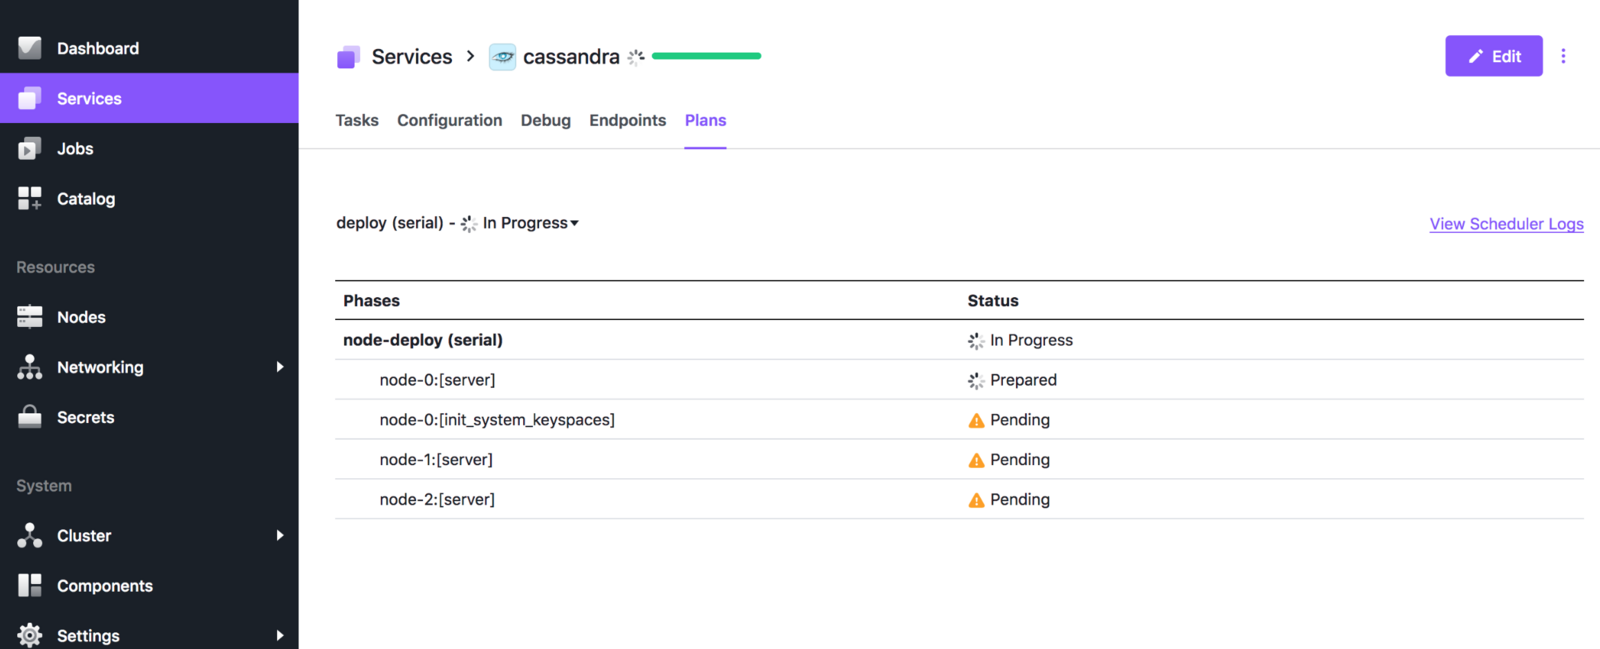
Click the service name to open the Services Instance page. The Services Instance page organizes information about services under five tabs. Each tab lists information in an easy to review listing of the configuration and performance of the service.

Figure 2 - Services instances
For services with a UI, hover over the service name and click  to view it. You can access the Mesos UI at
 <hostname>/mesos.
Debugging service deployments using the UI
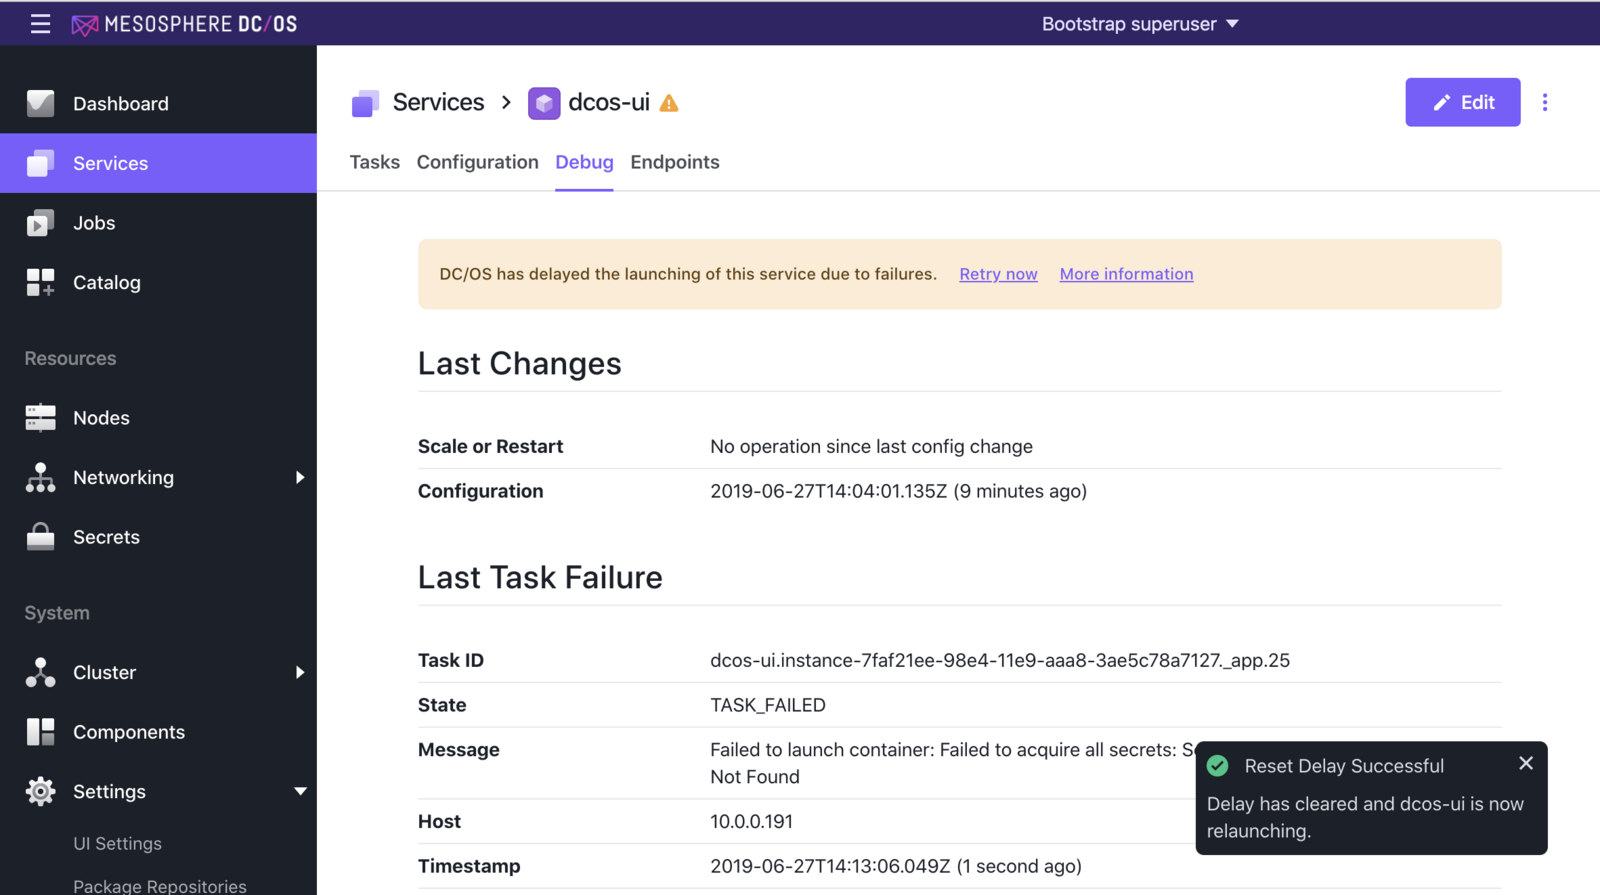
The Services > Debug tab displays the last changes, task failures, and other status messages, which can help debug issues with service deployments.
In the following figure, Marathon has failed to launch a service; DC/OS displays a warning message and then a message stating that the error has cleared and that the service is now launching.

Figure 3 - Debug tab showing warning
For more information about deploying services, see the Deploying Services and Pods documentation.
 DC/OS Documentation