KUDO Kafka
Kommander Catalog adds integration for KUDO Kafka Operator, which simplifies day 2 operations of Apache Kafka.
KUDO Introduction
Kubernetes Universal Declarative Operator (KUDO) provides a declarative approach to building production-grade Kubernetes operators.
- KUDO is built to help manage day 2 operations of services on Kubernetes, including stateful services, through the management of operators.
- KUDO is built to support upgrades of services along with backup, recovery, and the needs of observability.
- KUDO is integrated into Kommander and does not require any initialization via the KUDO CLI
The following articles give an overview of KUDO:
It is strongly recommended to view the KUDO Kafka Documentation which covers the KUDO Kafka Operator in-depth. This document covers the integration aspects of KUDO Kafka Operator with D2iQ Kommander.
Kommander Catalog
KUDO Kafka is located in the Kommander Catalog. To access the catalog:
- Create a Workspace
- Attach a Cluster to the Workspace
- Create a Project in the Workspace
- Select the created Project
- View the available Platform Services in the Project Catalog
- Select the version you’d like to deploy from the version drop-down, and then select Deploy.
Zookeeper
Apache Kafka has a dependency on Apache Zookeeper. The Kommander Catalog includes KUDO Zookeeper to be used in conjunction with KUDO Kafka.
The ZOOKEEPER_URI parameter configures which Zookeeper cluster to use.
- KUDO Zookeeper uses the following format:
<id>-cs.<namespace>:<client_port> - With
zookeeperlaunched in the namespacetest-project-zc6tcwe have this as theZOOKEEPER_URI:zookeeper-cs.test-project-zc6tc:2181
The ZOOKEEPER_PATH parameter configures the zNode path within the Zookeeper Cluster to use.
- When unspecified the zNode defaults to the id of the current Kafka instance being launched.
- When specified a mandatory leading slash is needed i.e
/kafka
Installation
From the Project Catalog select the desired version of Kafka and click Deploy.
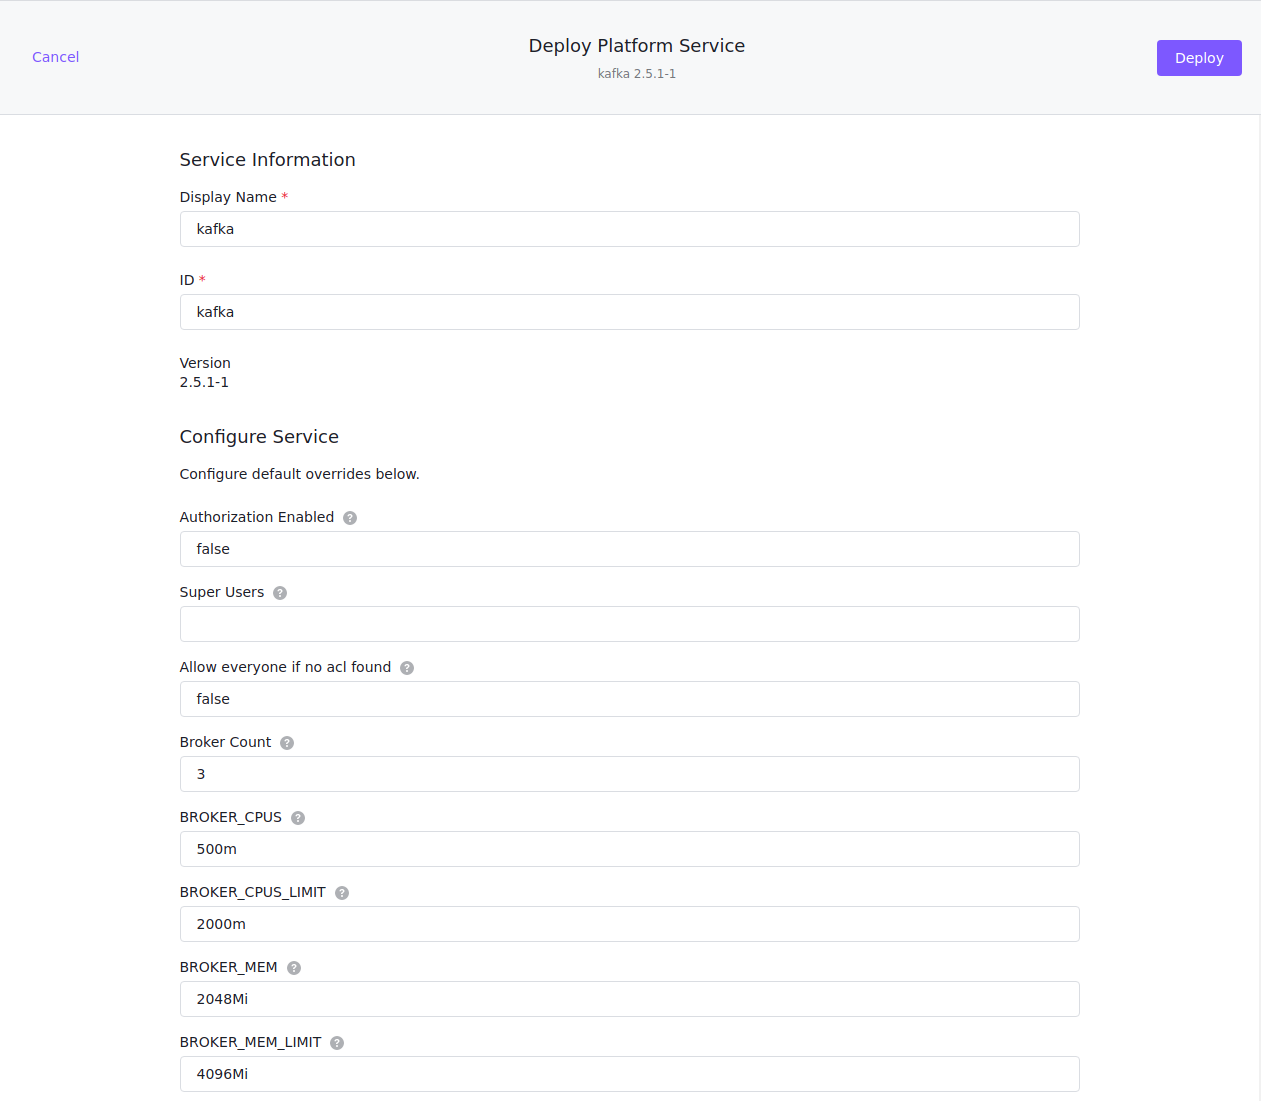
Below is an example of what should appear in the Kommander UI. The dialog is populated with sensible defaults:

- The ID field above is referred to as the Kafka
instanceby KUDO. - Detailed parameter descriptions and defaults are available for each version of KUDO Kafka Operator, in this case version
2.5.1-1.3.3
Select Deploy to install Kafka.
- Kommander will proceed to install
kudo-controller-managerin thekudo-systemnamespace if it does not already exist. This is the equivalent of issuingkubectl kudo initmanually on the CLI. - KUDO will then install Kafka in the Project namespace created using Kommander.
- The deployment progression can be viewed by looking at the
deployplan.
KUDO Kafka Service Status
The Operator Plan Status provides an overview of the service.
At this point, it is useful to have an understanding of KUDO Operator Plans and the KUDO CLI should be installed.
- Get the instances running in the project namespace.
Here we have kafka installed in the Kommander Project test-project with namespace test-project-zc6tc.
$ kubectl kudo get instances -n test-project-zc6tc
List of current installed instances in namespace "test-project-zc6tc":
.
├── kafka
└── zookeeper
- Get the Plan status from the KUDO Kafka Operator.
Here is a status summary of all plans after installation in the KUDO Kafka Operator
kubectl kudo plan status --instance kafka -n test-project-zc6tc
Plan(s) for "kafka" in namespace "test-project-zc6tc":
.
└── kafka (Operator-Version: "kafka-2.5.1-1.3.3" Active-Plan: "deploy")
    ├── Plan cruise-control (serial strategy) [NOT ACTIVE]
    │   └── Phase cruise-addon (serial strategy) [NOT ACTIVE]
    │       └── Step deploy-cruise-control [NOT ACTIVE]
    ├── Plan deploy (serial strategy) [COMPLETE], last updated 2021-04-15 02:28:18
    │   ├── Phase deploy-kafka (serial strategy) [COMPLETE]
    │   │   ├── Step generate-tls-certificates [COMPLETE]
    │   │   ├── Step configuration [COMPLETE]
    │   │   ├── Step service [COMPLETE]
    │   │   └── Step app [COMPLETE]
    │   └── Phase addons (parallel strategy) [COMPLETE]
    │       ├── Step monitoring [COMPLETE]
    │       ├── Step mirror [COMPLETE]
    │       └── Step load [COMPLETE]
    ├── Plan external-access (serial strategy) [NOT ACTIVE]
    │   └── Phase resources (serial strategy) [NOT ACTIVE]
    │       └── Step deploy [NOT ACTIVE]
    ├── Plan kafka-connect (serial strategy) [NOT ACTIVE]
    │   └── Phase deploy-kafka-connect (serial strategy) [NOT ACTIVE]
    │       ├── Step deploy [NOT ACTIVE]
    │       └── Step setup [NOT ACTIVE]
    ├── Plan mirrormaker (serial strategy) [NOT ACTIVE]
    │   └── Phase app (serial strategy) [NOT ACTIVE]
    │       └── Step deploy [NOT ACTIVE]
    ├── Plan not-allowed (serial strategy) [NOT ACTIVE]
    │   └── Phase not-allowed (serial strategy) [NOT ACTIVE]
    │       └── Step not-allowed [NOT ACTIVE]
    ├── Plan service-monitor (serial strategy) [NOT ACTIVE]
    │   └── Phase enable-service-monitor (serial strategy) [NOT ACTIVE]
    │       └── Step deploy [NOT ACTIVE]
    ├── Plan update-instance (serial strategy) [NOT ACTIVE]
    │   └── Phase app (serial strategy) [NOT ACTIVE]
    │       ├── Step conf [NOT ACTIVE]
    │       ├── Step svc [NOT ACTIVE]
    │       └── Step sts [NOT ACTIVE]
    └── Plan user-workload (serial strategy) [NOT ACTIVE]
        └── Phase workload (serial strategy) [NOT ACTIVE]
            └── Step toggle-workload [NOT ACTIVE]
- A
deployplan status ofCOMPLETEindicates that KUDO Kafka has deployed successfully and is healthy.
If any issues are encountered during the above, refer to the Troubleshooting section.
Available Parameters
The complete list of KUDO Kafka Parameters can be found under detailed parameter descriptions.
The current parameter set can be retrieved using the kubectl command in conjunction with two additional tools:
To retrieve the current parameters, issue the following command in the terminal with appropriate INSTANCE value set:
INSTANCE=kafka;
kubectl get instances -o json | jq ".items[] | select(.metadata.name == \"$INSTANCE\") | .spec.parameters" | yq -e --yaml-output '.' > kafka-params.yml
The above command generates a file called kafka-params.yml with the current values of all the parameters in effect for the kafka instance.
Updating Parameters
Parameters can be updated using arguments to the KUDO CLI.
Example: Increasing Kafka broker counts
- Increase the number of nodes using the KUDO CLI:
kubectl kudo update --instance kafka -p BROKER_COUNT=4 -n test-project-zc6tc
- Monitor the KUDO Cassandra deployment plan:
kubectl kudo plan status --instance kafka -n test-project-zc6tc
- Wait for the deployment plan to have a status of
COMPLETE
When the deployment plan is COMPLETE there should be 4 nodes as seen by the number of pods running:
kubectl get pods -n test-project-zc6tc
NAME                    READY   STATUS    RESTARTS   AGE
kafka-kafka-0           2/2     Running   0          12m
kafka-kafka-1           2/2     Running   0          11m
kafka-kafka-2           2/2     Running   0          11m
kafka-kafka-3           2/2     Running   0          77s
zookeeper-zookeeper-0   1/1     Running   0          28m
zookeeper-zookeeper-1   1/1     Running   0          28m
zookeeper-zookeeper-2   1/1     Running   0          28m
Example: Updating multiple parameters:
To update multiple parameters at once, it is recommended to submit the updated parameters using the KUDO CLI.
See Available Parameters to get the full list of current parameters as a file.
Apply the desired updates in kafka-params.yml using the KUDO CLI:
kubectl kudo update -n test-project-zc6tc --instance=kafka -P kafka-params.yml
Wait for the deployment plan to COMPLETE as shown in the Kafka broker counts example.
Upgrades
KUDO Kafka versions can be upgraded using the KUDO CLI.
Example Upgrade KUDO Kafka from v2.5.0-1.3.1 to v2.5.1-1.3.3:
When upgrading, you should understand the mapping between Kafka versions and operator versions. For more information, see the table at the end of the Kafka operator repository.
kubectl kudo upgrade kafka --instance kafka --operator-version 1.3.3
Wait and monitor the deployment plan to become COMPLETE.
Monitoring
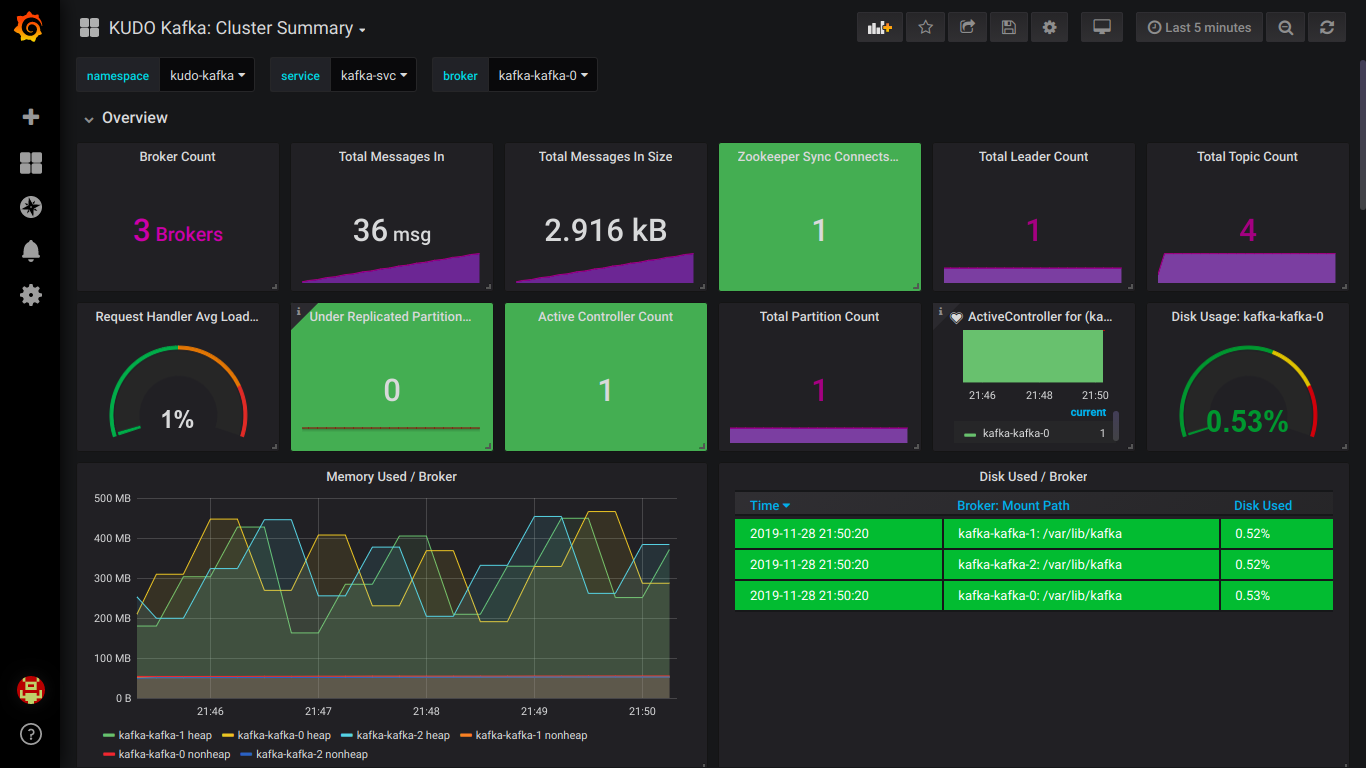
Kommander includes Prometheus and Grafana as part of the federated Workspace Platform Services along with Centralized Monitoring.
KUDO Kafka operator can export metrics to Prometheus, to do so set the METRICS_ENABLED parameter to true:
kubectl kudo update -p METRICS_ENABLED=true --instance kafka -n test-project-zc6tc
- Each broker bootstraps with the JMX Exporter java agent exposing the metrics at
9094/metrics, along with a Prometheus Node Exporter sidecar exposing container metrics at9096/metrics. - Adds a port named
metricsandne-metricsto the Kafka Service. - Adds a label
kudo.dev/servicemonitor: "true"for the service monitor discovery. - Mounts a config map with metrics reporter for the broker container.
Sample Grafana Dashboards can be found in the monitoring directory.
Grafana dashboards can be imported or recurring dashboards can be defined inline for Kommander to import through adding custom dashboards.

Kafka MirrorMaker
KUDO Kafka comes integrated with MirrorMaker
MirrorMaker is a tool to mirror a source Kafka cluster into a target (mirror) Kafka cluster. This tool uses a Kafka consumer and a Kafka producer. The consumer consumes messages from the source cluster. The producer re-publishes those messages to the target cluster.
MirrorMaker integration is disabled by default, details on how to enable it are found in the Kafka Operator docs.
Kafka Connect
KUDO Kafka comes integrated with Kafka Connect.
Kafka Connect is a tool for scalably and reliably streaming data between Apache Kafka and other systems. It provides a REST API to configure and interact connectors.
Kafka Connect integration is disabled by default, details on how to enable it are found in the Kafka Operator docs.
Cruise Control
KUDO Kafka comes integrated with Cruise Control.
Cruise Control is a tool to fully automate the dynamic workload rebalance and self-healing of a Kafka cluster. It provides great value to Kafka users by simplifying the operation of Kafka clusters.
Cruise Control integration is disabled by default, details on how to enable it are found in the Kafka Operator docs.
External Access
For Producers and Consumers living outside the Kubernetes cluster, KUDO supports LoadBalancer and NodePort approaches, the LoadBalancer approach is the recommended one. The Kafka Operator docs detail to connect to external Producers and Consumers.
Troubleshooting
KUDO provides the ability to collect logs and other diagnostics data for debugging and for bug-reports.
kubectl kudo diagnostics collect --instance kafka -n test-project-zc6tc
The diagnostics data contains the following:
KUDO Environment
- Installed Manager and its logs.
- Service account and services.
Data for the specified Operator
- The Operator, OperatorVersion and Instance resources.
- Deployed resources from the operator.
- Logs from the deployed pods.
To monitor all the events occurring in the namespace, its helpful to look at event log:
kubectl get events -w -n test-project-zc6tc
 Kommander Documentation